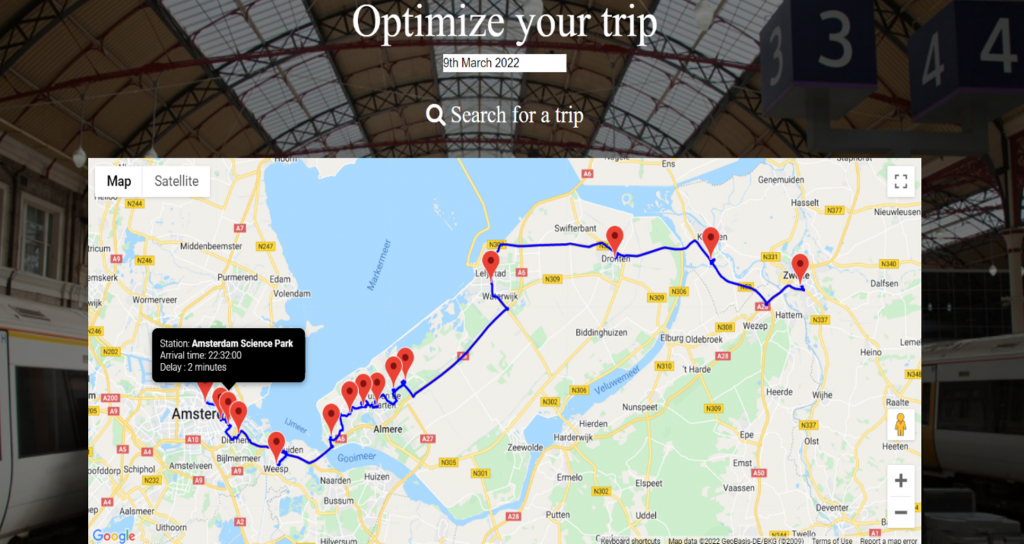
Trip Optimizer
Data visualization
Visualizing data using frameworks such as Tableau helps to identify the patterns in the data such as what are the most important factors causing the delay of the train
External factors affecting the delay and load
Can select only important features needed to train a ML model by discarding all the other features which do not effect the delay
Prediction can be done using classification, clustering and time series forecasting
Time series analysis uses the data for a period of time and predict for the next period
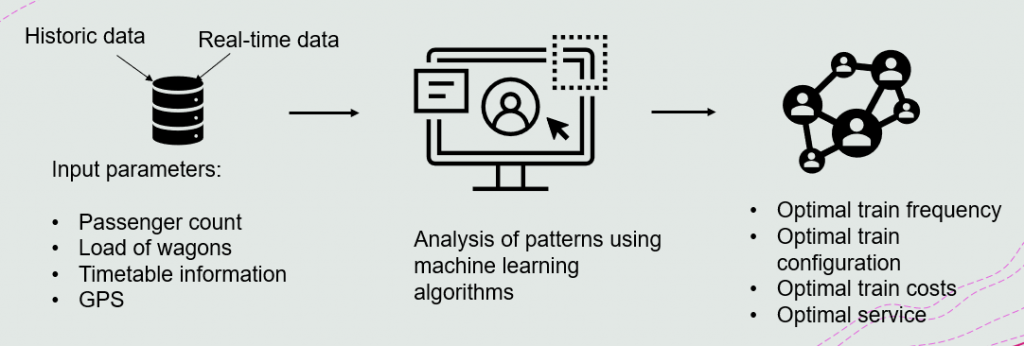
The input data consists of the information about origin, destination , delay and passenger load
Goal : To predict future delays and passenger load
Best fitting model to be determined
Machine learning models – Linear regressors
Polynomial regressors
K- Nearest Neighbours (KNN)
Deep learning models – Recurrent Neural Networks (RNN)
Long Short Time Memory units (LSTM)
+
.